
Political campaigners must focus on the efficiency of their votes

Labour’s main issue in 2019 was NOT vote share per se; in 2019, Labour got 32%, a better performance than 2015, 2010, and not that much worse than 2005. The issue is how that vote is distributed. Unfortunately, Corbyn’s campaign in 2019 achieved almost the worst possible distribution of votes. Votes piled up in major cities and university towns, at the expense of the “Red Wall”. Therefore, it is clear that campaigners must focus on how efficiently each additional vote share translates into seats. I develop a simple measure, the ‘efficiency ratio’ to encapsulate this idea in an intuitive manner.
This efficiency ratio is given by:
Campaign efficiency = (% of seats)/(% of votes)
Intuitively, this tells us how many seats can a party achieve for a given vote share. How many seats can a party gain for each additional percentage point of the vote?
Let us illustrate how this measure works with a few calculations:
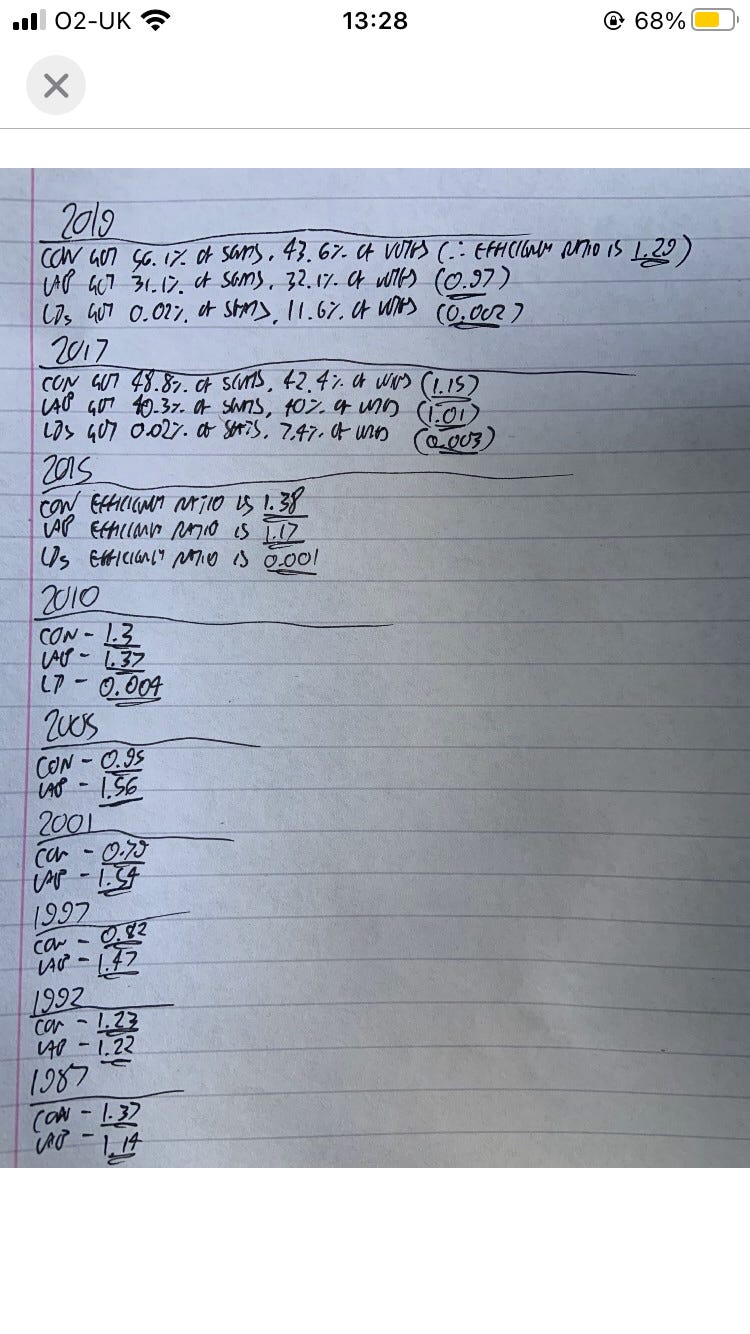
Here, you can see a marked decline in Labour’s efficiency ratio from 2015 onwards, under Corbyn. Whilst in 2017, Labour had its best result (in terms of vote share) since 2001, it was much less efficient at converting this into seats relative to 2001, and crucially, 2015.
Moreover, whilst there are not enough data points to make a sound judgement here (it would be interesting to replicate this exercise for local elections, devolved elections, and so on too), it appears that this ratio appears stable with respect to the leader. Changes in leadership tend to be associated with changes in efficiency ratios. Correlation is not causation (maybe the causal factor here is how different leaders conduct campaigns? There are a lot of leaders in their position for one election only too, which could distort the results?), however, the extent to which leadership (and how it interacts with the other possible variables) affects this efficiency ratio is an intriguing topic for further explanation. Perhaps one for the political scientists? I would be welcome to hear your thoughts on this?
In any case, the above calculations imply that Corbyn’s greatest failure was a remarkable decline in Labour’s efficiency ratio. Indeed, this occurred in 2017 (widely considered a relative success for Labour), however its strong performance in terms of vote share masked this worrying trend.
However, there is plenty of cause for optimism. Labour is starting from a position of a greater vote share, more seats, and a higher efficiency ratio, than the Conservatives did throughout the Blair landslides. If the Conservatives returned to power a decade later, under more adverse circumstances, then there is no reason why Labour cannot replicate a similar comeback. Such is the nature of majoritarian politics under FPTP: the narrative is always whether the losing party will ever return to power, then this cycle perpetually repeats itself. We have been here before. Relax! Labour is not dead!
For the more psephologically minded readers, this measure is not without its limitations. First of all, under FPTP, this measure is perhaps only useful when considering the two major parties. This ratio for the LDs is close to zero, regardless of the election. Given the nature of FPTP, this is expected for third parties without regional concentrations.
It then follows that, some parties only contest seats in specific regions of the country. Hence, using their national percentage of seats, and their national vote share figures, will understate their efficiency ratio. Instead, when dealing with these parties, one should recalibrate using the regional equivalents. For instance, using the national figures for the SNP, in 2019, will result in a ratio figure of 0.002. On the other hand, this figure is an impressive 1.81 when using regional figures.